If you have been tracking the Indian IT and ER&D (Engineering, Research, and Development) sector over the last few quarters, you know the narrative. It has been a story of patience, frustration, and consolidation. While the broader Nifty 50 index was scaling new all-time highs, premium technology stocks were largely sitting on the sidelines, digesting the post-COVID valuations and navigating global headwinds.
L&T Technology Services (LTTS) was no exception.
For months, LTTS has been trapped in a corrective phase. Investors watched as the stock price drifted lower, grinding through support levels and testing the patience of long-term holders. However, in the world of technical analysis, “the trend is your friend until it bends.”
And right now? It looks like the trend is bending.
We are currently witnessing a textbook technical setup on the daily and weekly charts of LTTS: The Falling Channel Bullish Reversal.
This isn’t just a random tick up in price. It is a structural shift in the supply and demand dynamics of the stock. In this extensive guide, we are going to deconstruct this trade setup piece by piece. We will look at the psychology behind the pattern, the confirmation indicators you need to watch, the fundamental backdrop, and, most importantly, how to manage your risk if you decide to take the trade.
Whether you are a swing trader looking for a momentum burst or a long-term investor looking for a bottom-fishing opportunity, this analysis is for you.
Part 1: Understanding the "Falling Channel" Pattern
Before we dive into the specific levels for LTTS, we must understand the vehicle we are driving. What exactly is a Falling Channel (or Descending Channel), and why should you care?
The Geometry of Price Correction
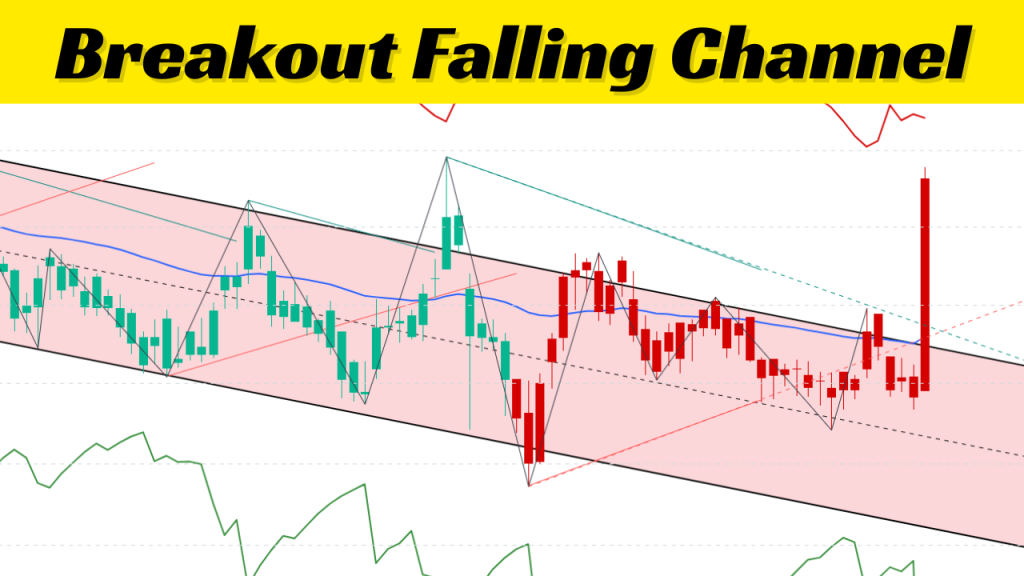
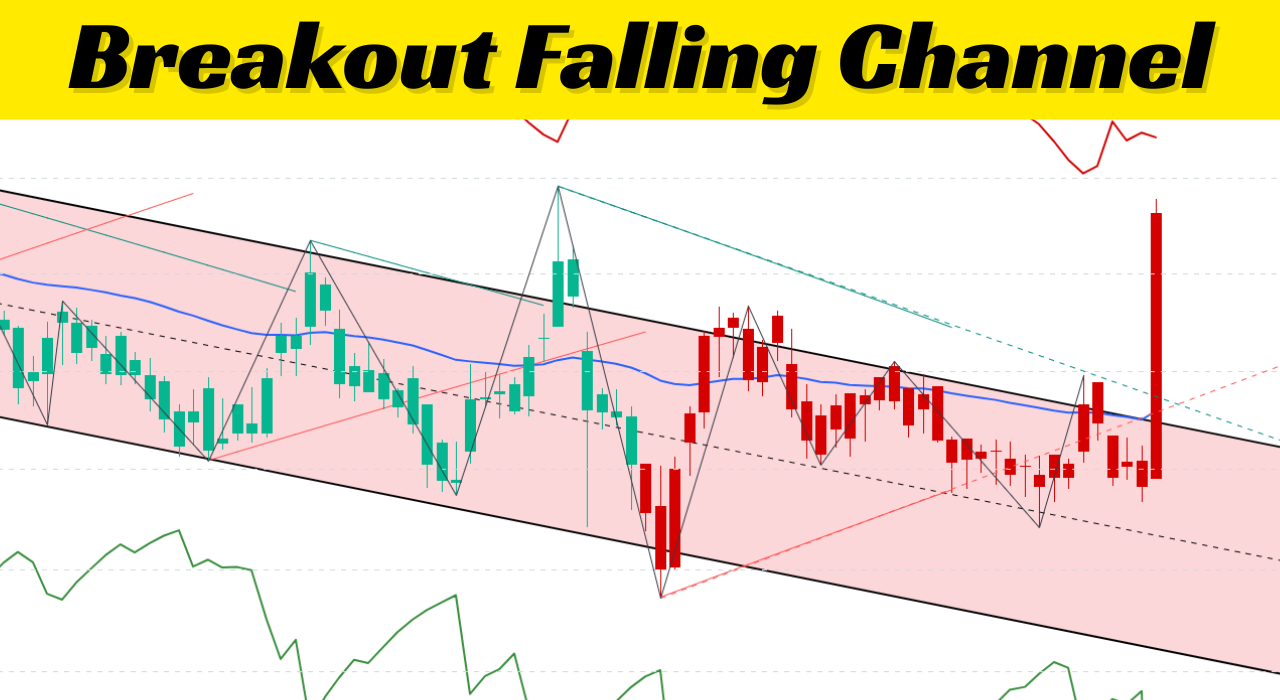
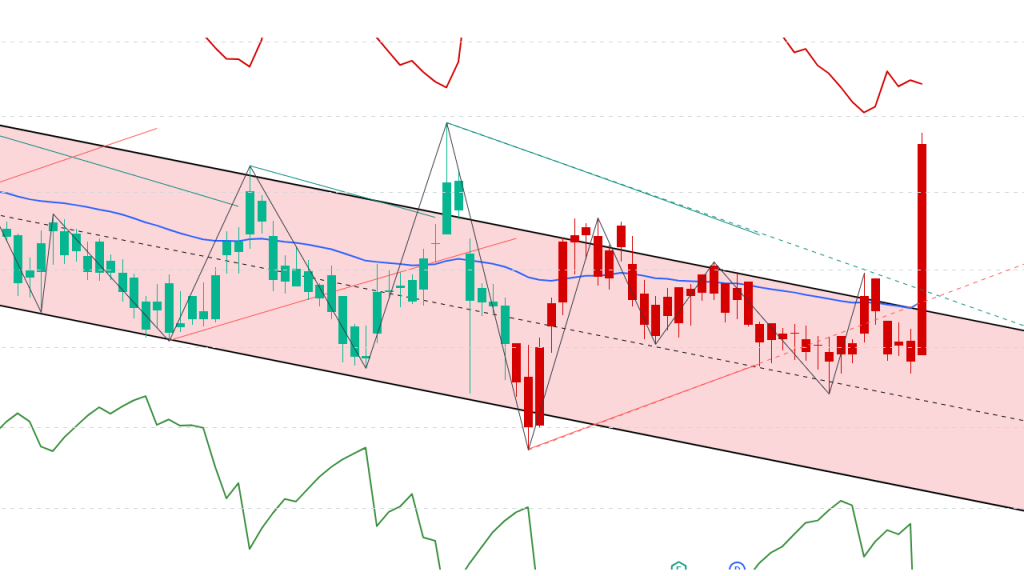
A Falling Channel is a chart pattern formed by two downward-sloping parallel lines that contain the price action of a stock.
The Upper Trendline: This connects the “Lower Highs.” Every time the stock tries to rally, sellers step in at this line and push it back down. It acts as dynamic resistance.
The Lower Trendline: This connects the “Lower Lows.” Every time the stock crashes, value buyers step in at this line to bounce it up. It acts as dynamic support.
The Psychology: The Battle of Bears and Bulls
When LTTS was stuck inside this channel, it represented a controlled downtrend. It wasn’t a panic crash; it was an orderly sell-off.
The Bears were in control, ensuring that every rally was sold into.
The Bulls were tentative, only buying when the price looked “cheap” at the lower trendline.
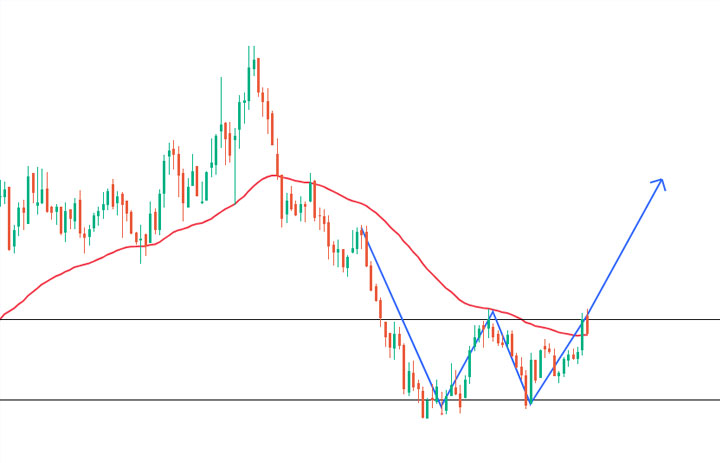
The Breakout: A “Bullish Reversal” occurs when the price decisively breaks above the Upper Trendline. This is a significant psychological shift. It means the sellers who used to defend that line have been exhausted. The buyers have absorbed all the supply and are now willing to pay higher prices. The “Lower High, Lower Low” sequence is broken.
Part 2: Deconstructing the LTTS Setup
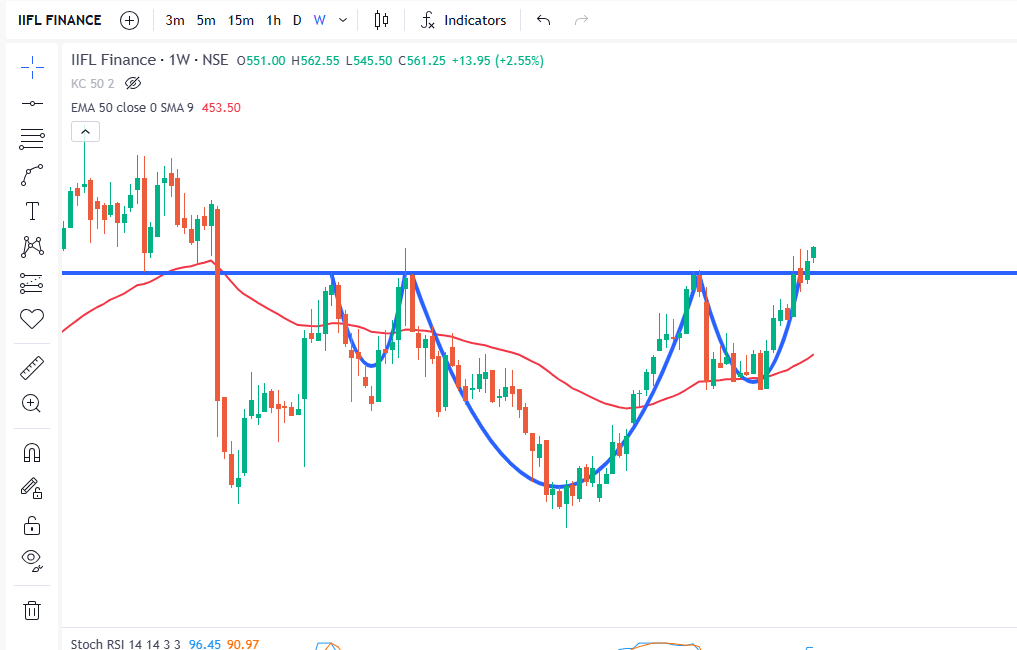
Now, let’s apply this theory to the L&T Technology Services chart.
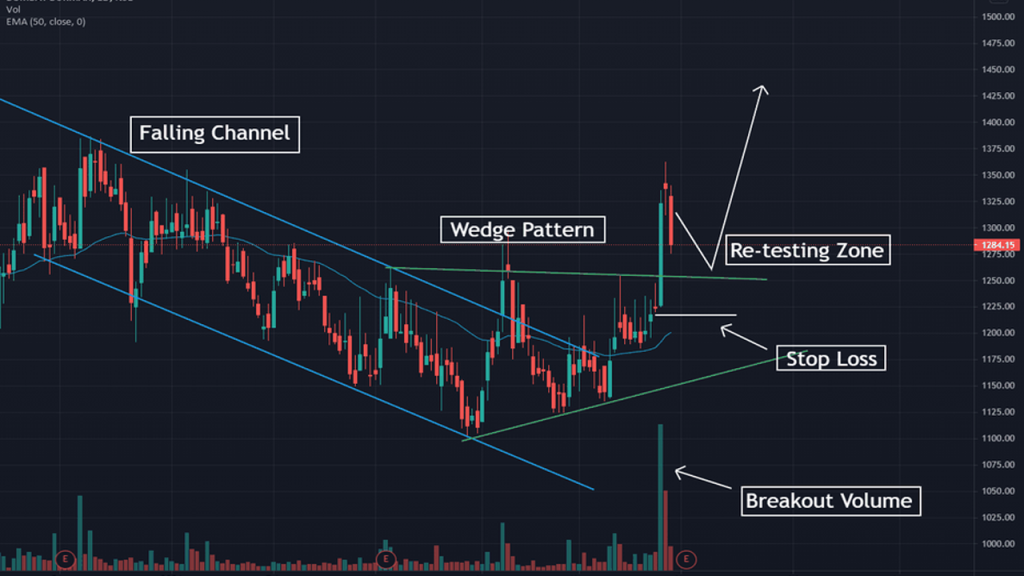
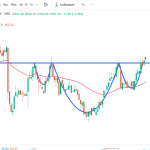
Over the past several months, LTTS has respected this Falling Channel with almost algorithmic precision. If you look at the daily chart, you will see multiple touchpoints on both the upper and lower boundaries. These touchpoints validate the pattern—the more times the price respects the lines, the more explosive the eventual breakout tends to be.
1. The Breakout Candle
Recently, LTTS staged a move that breached the upper resistance line of the channel.
What we look for: We don’t just want the price to peek above the line during the day and then fall back (leaving a long wick). That is a “fakeout.”
What happened: LTTS managed a strong closing above the trendline. A solid green candle body closing outside the channel indicates that the bulls held their ground until the market close.
2. The Volume Confirmation (Crucial!)
Technical analysis follows a golden rule: Volume precedes Price. A breakout without volume is like a car trying to climb a steep hill without gas—it will roll back down.
Analysis: On the day of the LTTS breakout, did you notice the volume bars? We are looking for volume that is significantly higher than the 10-day or 20-day average.
Interpretation: High volume indicates institutional participation. Retail traders (small investors) cannot move a stock like LTTS on their own. When you see a volume spike accompanying a breakout, it means “Smart Money” (FIIs or DIIs) is accumulating shares. They are betting on a trend change.
3. Change of Polarity
Once the breakout happens, the psychology flips. The Upper Trendline, which acted as a ceiling (Resistance), now often becomes the floor (Support). This is known as the Change of Polarity. If LTTS dips slightly in the coming days, do not panic. It is common for stocks to “retest” the breakout level. As long as the price holds above the previous resistance line, the setup remains valid.