Astral Double Bottom Breakout Signals Strong Reversal
- BY pankajnifty
- November 15, 2025
- 0 Comments
- 682 Views
The 'W' Stands for Win? Decoding Astral Limited's Powerful Double Bottom Breakout
For chart watchers and technical traders, some patterns are a sight for sore eyes. They signal a potential shift in momentum, a story of struggle and triumph playing out in candlesticks. One of the most reliable of these is the “Double Bottom,” and right now, Astral Limited is painting a textbook example on the charts.
The stock has decisively broken out of this classic bullish reversal pattern, suggesting that the recent downtrend may be over and a new upward journey could be just beginning.
Let’s break down what this means, what to look for, and why it’s got the market talking.
First, What is a Double Bottom Pattern?
Before we dive into Astral’s specifics, let’s quickly recap this pattern.
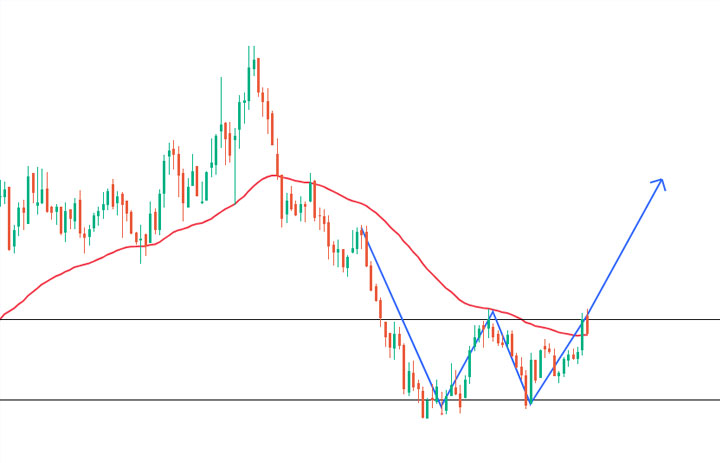
Think of it as the shape of the letter ‘W’.
First Trough: The stock hits a low, bounces back up.
Intermediate Peak: The bounce hits a point of resistance (the middle of the ‘W’) and pulls back. This resistance level is called the “neckline.”
Second Trough: The stock falls again, but finds support at or near the same level as the first low. This failure to make a new low is a crucial sign of seller exhaustion.
The Breakout: The stock rallies again, and this time, it powerfully breaks above the neckline.
Why is it significant? A double bottom indicates that the stock has established a strong support level and the bears have failed twice to push the price lower. The breakout above the neckline signals that the bulls have officially taken control, and the previous downtrend has likely reversed.
![Image placeholder: A generic diagram of a Double Bottom ‘W’ pattern, with labels for Trough 1, Trough 2, Neckline, and Breakout Point.]
(A simple chart diagram here would be perfect for your blog!)
Astral Limited on the Charts: A Closer Look
Astral’s recent price action has followed this script beautifully.
The stock established a strong support base, forming two distinct lows around the same price level. This showed that buyers were consistently stepping in to defend that price.
After the second low, the stock rallied with conviction.
The key moment came when the price decisively crossed and closed above the neckline resistance.
Crucially, this breakout appears to be supported by strong volume. A surge in trading volume during a breakout is a powerful confirmation. It shows that there is widespread participation and conviction behind the move, reducing the chances of it being a “false” signal.
What Could This Breakout Mean for Astral?
A breakout from a double bottom pattern often comes with a calculated potential target, giving traders an idea of how high the stock might go.
How to calculate the target:
Measure the height of the pattern (the distance from the lowest trough to the neckline).
Add that height to the breakout point (the neckline price).
Example (using hypothetical numbers for illustration):
If the troughs were at ₹1800 and the neckline was at ₹2000, the height of the pattern would be ₹200.
The potential target would be ₹2000 (neckline) + ₹200 (height) = ₹2200.
(Please replace these with the actual levels from your chart analysis for accuracy.)
This technical strength doesn’t exist in a vacuum. Astral is a fundamentally strong company with a leading position in the CPVC pipes and adhesives sectors. This technical signal, backed by solid fundamentals, makes the case even more compelling for long-term investors.
Key Levels to Watch for Astral Limited
For anyone tracking the stock, here are the critical levels to keep on your radar:
Breakout Level / New Support: The previous neckline. Now that the price is above it, this level is expected to act as a strong support zone on any pullbacks.
Major Support: The level of the double bottoms. A break below this would invalidate the bullish pattern.
Potential Target: The calculated target based on the pattern’s height. This will act as the next major resistance area.
The Bottom Line
No chart pattern is a guarantee, and market conditions can always change. However, Astral Limited’s breakout from a classic double bottom pattern is a significant technical development that cannot be ignored.
It suggests a clear reversal of the prior downtrend and the potential for a sustained move upwards. For traders and investors, this is a prime example of how technical analysis can help identify key turning points in a stock’s journey.
The stage is set. Now, we watch to see if the bulls can carry this momentum forward.
Disclaimer: This blog post is for educational and informational purposes only and should not be considered investment advice. The stock market involves risks, and you should always conduct your own research and consult with a qualified financial advisor before making any investment decisions.