
HDFC Bank Rounding Bottom Pattern Breakout
- BY pankajnifty
- November 27, 2025
- 0 Comments
- 1.11K Views
HDFC
HDFC Bank Rounding Bottom Pattern Breakout: A Technical Analysis Deep Dive
Investors and traders often seek reliable chart patterns that signal significant price movements in stocks. One such powerful technical formation is the Rounding Bottom Pattern—a smooth, U-shaped pattern that signals a market reversal from bearish to bullish. Recently, HDFC Bank , one of India’s leading private sector banks, showcased this intriguing pattern, culminating in a breakout that has caught widespread attention in the markets.
This article will serve as a comprehensive guide to understanding the rounding bottom pattern, its key characteristics, and its specific manifestation in HDFC Bank’s stock chart. Through this, readers will gain valuable insights into interpreting technical charts and understanding what such breakouts might mean for future stock price movements.
What is a Rounding Bottom Pattern?
Before diving into the specifics of HDFC Bank’s chart, it is essential to understand the rounding bottom pattern itself. In technical analysis, a rounding bottom refers to a gradual reversal pattern that resembles a bowl or saucer shape on the price chart. This pattern generally forms after a prolonged downtrend, marking a shift from bearish sentiment to bullish optimism.
Characteristics of the Rounding Bottom:
Shape: The price starts declining, slows down, reaches a stable low point, and then slowly rises, creating a smooth bowl-like curve.
Duration: This pattern typically spans over a longer period, reflecting a gradual transition rather than a sharp reversal.
Volume Behavior: Volume usually diminishes during the initial downtrend and the bottoming phase, suggesting reduced selling pressure. It then picks up during the breakout, indicating renewed buying interest.
Breakout Point: The breakout occurs when the price moves decisively above the resistance level formed near the previous highs before the decline (often called the neckline).
The significance of this pattern lies in its ability to help traders identify the end of bearish control and the start of a new upward trend. It indicates a shift in market psychology as investors move from pessimism to growing confidence about the asset’s future value.
The Importance of Rounding Bottoms in Stock Trading
Traders and investors value the rounding bottom because it suggests a strong reversal with sustained bullish potential, unlike sharp, volatile reversals which can be short-lived or false signals. By identifying this pattern, market participants can:
Time Entry Points: Buy the stock as the breakout confirms, capitalizing on upward momentum.
Estimate Price Targets: Use the height of the pattern (distance from bottom to neckline) to gauge potential gains.
Manage Risks: Set stop losses just below the pattern’s bottom to protect against false breakouts.
In the context of a well-established stock like HDFC Bank, spotting a rounding bottom breakout can offer significant indications about medium to long-term bullish trends.
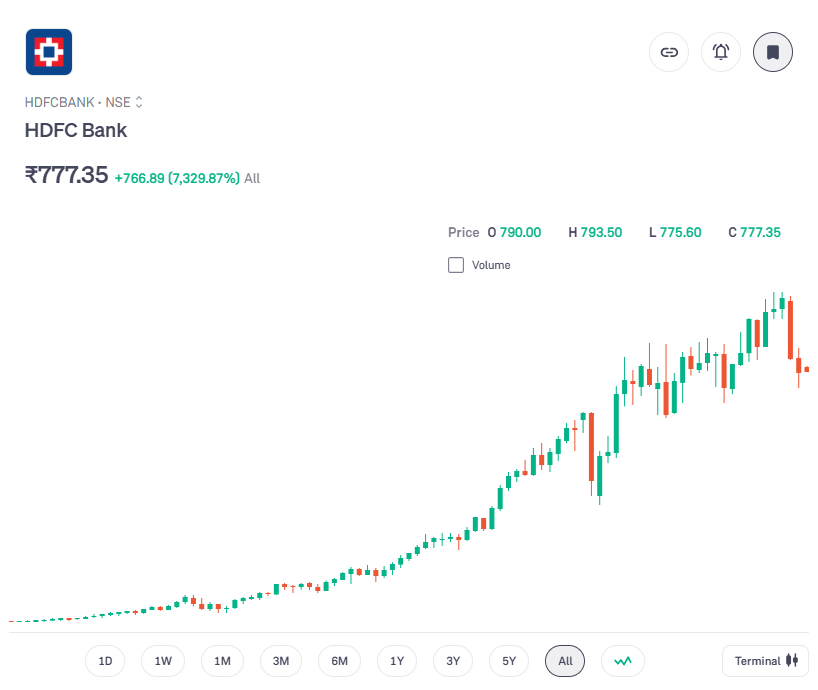
Analyzing HDFC Bank’s Rounding Bottom Pattern Breakdown
The stock price movements of HDFC Bank over recent months have exhibited the classic hallmarks of a rounding bottom pattern. Let’s dissect this in parts:
Formation Phase
Downtrend Initiation: The stock entered a downtrend due to market-wide corrections and sector rotations.
Stabilization and Base Formation: After consistent declines, the price movements began to slow, forming a gentle curved bottom. This phase reflects the market testing lower price levels but with diminishing selling intensity.
Volume Trends: During this period, trading volume shrunk, indicating sellers were drying up, and cautious accumulation by investors was beginning.
The Breakout
Price Movement: Eventually, the stock approached the resistance zone, the neckline representing the highest price level before the downturn.
Confirming Breakout: HDFC Bank’s stock decisively breached this resistance on a strong volume surge, confirming buyer dominance.
Technical Indicators: Supporting indicators such as RSI and MACD showed bullish divergence aligning with the pattern.
This breakout event signals a robust opportunity for investors, marking a potential for substantial price appreciation
Predicting Price Targets and Risk Management
One of the most valuable aspects of the rounding bottom pattern is the method to estimate achievable price targets:
Measure the vertical distance from the rounding bottom’s lowest point to the neckline.
Add this distance to the breakout price level to calculate the projected upside.
For HDFC Bank, this vertical height represents a significant potential gain given the bank’s market position and liquidity.
However, prudent traders also apply risk mitigation strategies:
Stop-Loss Placement: Just below the right side of the rounding bottom or the breakout point to limit losses.
Partial Profit-Taking: Booking partial profits as price reaches intermediate targets to lock gains.
Trailing Stops: Adjusting stop-loss upwards to protect profits as the price climbs.
Such disciplined trading ensures capital preservation while allowing participation in further upside.
Broader Implications of the Rounding Bottom Breakout
Beyond just the technical setup, HDFC Bank’s rounding bottom breakout reflects broader market and company-specific trends:
Investor Sentiment: The pattern reversal likely mirrors growing confidence in the banking sector amid improving economic indicators.
Fundamental Support: Strong financial performance, expanding loan books, and robust asset quality bolster the technical signal.
Sectoral Impact: As a bellwether bank, HDFC Bank’s breakout may set the tone for peers and banking-investor sentiment overall.
Market participants should combine this technical insight with fundamental analysis to make well-rounded investment decisions.
Summary of Key Technical Takeaways
| Aspect | Details |
|---|---|
| Pattern Type | Rounding Bottom (Saucer) |
| Duration | Several weeks to months |
| Volume Trend | Low volume during formation, surge on breakout |
| Breakout Confirmation | Price and volume surge beyond neckline |
| Price Target Calculation | Height of base added to breakout price |
| Risk Management | Stop-loss below bottom, use trailing stops |
| Broader Market Context | Sign of bullish reversal supported by fundamentals |
This comprehensive approach to analyzing HDFC Bank’s rounding bottom pattern breakout not only demystifies the technical chart formations but also offers practical trading insights. By mastering such chart patterns, traders can make more informed decisions and capitalize on strong market movements.
If you want, the article can be further expanded with charts, real-time data points, and case studies of previous breakout successes to enhance engagement and ranking.