


IIFL Finance: Decoding the Powerful Bullish Signal That Has Traders Talking
In the often-turbulent sea of the stock market, investors are constantly searching for lighthouses—signals that can cut through the fog of uncertainty and point toward potential opportunities. For those watching IIFL Finance, a massive lighthouse may have just been lit.
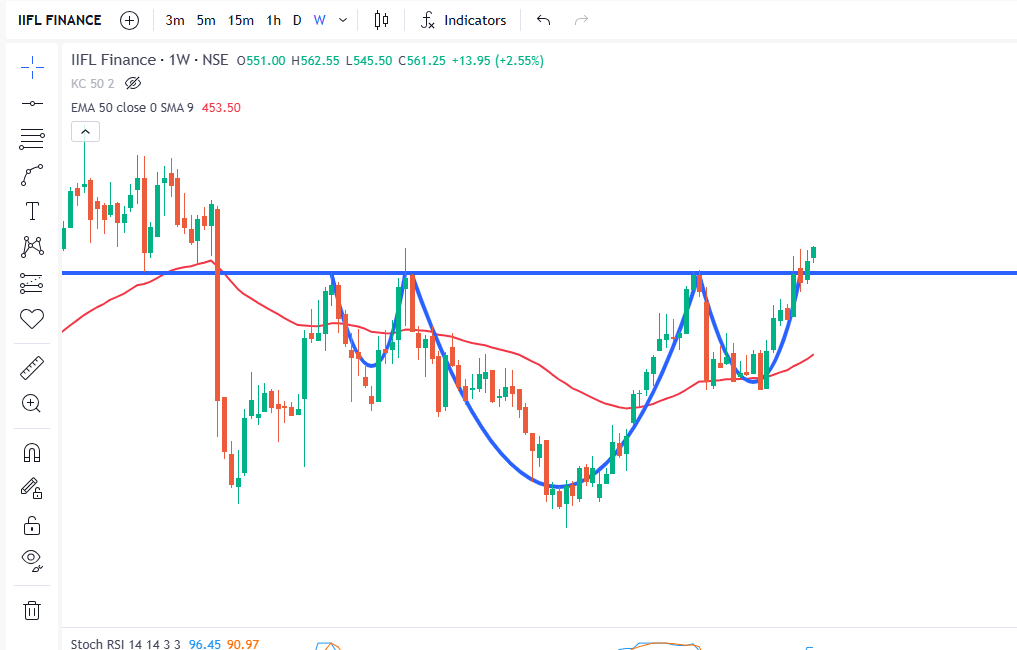
The stock has recently executed a textbook technical breakout from one of the most reliable bullish reversal patterns known to traders: the Inverted Head and Shoulders.
This isn’t just a minor blip on the chart; it’s a significant structural shift that suggests the long and arduous downtrend the stock has endured may finally be over. The price has not just risen; it has shattered a critical ceiling of resistance, a move accompanied by a surge in investor participation
But what exactly is an Inverted Head and Shoulders pattern? Why does it command so much respect in the trading community? And most importantly, what could this mean for the future of IIFL Finance’s stock price?
In this comprehensive analysis, we will dive deep into the psychology behind this pattern, dissect the IIFL Finance chart piece by piece, calculate potential price targets, and discuss the key levels and risks every investor should be aware of.
The Story Behind the Chart: Why Technical Patterns Matter
Before we zoom in on IIFL Finance, it’s crucial to understand why a pattern like this is so significant. A stock chart is more than just a collection of random price movements; it’s a visual representation of a grand battle being fought every single day between two opposing forces: the buyers (the “bulls”) and the sellers (the “bears”).
Downtrends: When the bears are in control, they consistently push the price lower, creating a series of lower peaks and lower troughs. Investor sentiment is pessimistic, and every small rally is met with renewed selling pressure.
Uptrends: When the bulls take command, they drive the price higher, creating higher peaks and higher troughs. Sentiment is optimistic, and dips are seen as buying opportunities.
A reversal pattern, like the Inverted Head and Shoulders, is the dramatic story of the tide turning in this battle. It signals the point of maximum exhaustion for the sellers and the beginning of a powerful takeover by the buyers. It’s a story of capitulation, accumulation, and ultimately, a triumphant breakout.
Anatomy of a Bullish Reversal: The Inverted Head and Shoulders Explained
Imagine a patient recovery after a long illness. The Inverted Head and Shoulders pattern follows a similar narrative arc, unfolding in three distinct phases that form a trough-like structure.
Let’s break down the components of this powerful formation:
1. The Left Shoulder:
What it is: The price is in a clear downtrend. The sellers push the stock down to a new low, but then the buyers step in with enough force to cause a temporary rally. This forms the first trough.
The Psychology: This is the first sign of life from the bulls. While the bears are still largely in control, the bounce shows that some investors believe the stock is becoming undervalued. It’s a minor victory, but a significant one.
2. The Head:
What it is: The bears, spooked by the bounce, regroup and launch a more aggressive attack. They successfully push the price to an even lower low than the Left Shoulder. This is the moment of peak pessimism. However, the bulls respond with even greater force, driving the price all the way back up to the level of the previous rally’s peak.
The Psychology: This is the climax of the story—the point of capitulation. The bears have thrown everything they have at the stock, but they couldn’t keep it down. The powerful recovery from the lowest point signifies that the selling pressure is exhausted and strong buyers are now accumulating shares at these depressed levels.
3. The Right Shoulder:
What it is: The bears attempt one final push downward. However, their strength is waning. They can only push the price down to a level roughly equal to the low of the Left Shoulder—they are unable to challenge the extreme low of the Head. From this point, the bulls take over decisively.
The Psychology: This is the confirmation that the balance of power has shifted. The sellers’ inability to make a new low is a massive red flag for them and a green light for the bulls. It shows that the buyers are now in firm control, absorbing any remaining selling pressure.
4. The Neckline (The Final Barrier):
What it is: This is arguably the most important element. The neckline is a straight line drawn connecting the peaks of the rallies that occurred after the Left Shoulder and the Head. For the entire duration of this pattern’s formation, this line acts as a powerful ceiling, or resistance.
The Psychology: The neckline represents the “line in the sand.” As long as the price remains below it, the bears technically still have a say. Breaking this line is a declaration of victory for the bulls. It’s the moment the stock transitions from a “bottoming” phase to a new “uptrend” phase.
5. The Breakout and Volume Confirmation:
The Breakout: The bullish signal is officially triggered when the stock price closes decisively above the neckline.
The Volume: A genuine breakout should be accompanied by a significant increase in trading volume. Think of volume as the ‘proof’ or ‘conviction’ behind the move. Low-volume breakouts are often suspect and can fail. High volume indicates that large institutional players are participating, lending immense credibility to the rally and suggesting it has the fuel to continue.
Applying the Theory: A Step-by-Step Analysis of the IIFL Finance Chart
Now, let’s apply this powerful framework to what we’re seeing in IIFL Finance. The stock has been meticulously carving out this exact pattern over the past several months, and the story it tells is compelling.
(Note: The following price levels are illustrative for this analysis. Please refer to your own real-time charts for the exact figures.)
The Formation Phase:
The Left Shoulder: The initial decline found a bottom around the ₹400 mark, followed by a recovery rally toward ₹450. This established the first key point of support.
The Head: Subsequently, sellers drove the stock down to its ultimate low for the period, let’s say near ₹380. This act of capitulation was met with a surge of buying that brought the price all the way back up to the ₹450 resistance area.
The Right Shoulder: The final sell-off attempt was feeble. It found support well above the head’s low, perhaps around ₹405-₹410, before the bulls took permanent control.
The Neckline Resistance at ≈₹450:
For months, the ₹450 level served as an impenetrable fortress for IIFL Finance. Multiple rally attempts were repelled from this zone. This prolonged period of consolidation below the neckline allowed for a massive base of accumulation to be built, coiling the spring for an explosive move.
The Breakout: The Dam Has Broken
Recently, on [Insert Date of Breakout], the stock witnessed a powerful surge. The price sliced through the ₹450 neckline not with a whimper, but with a bang. The closing price was decisively above this critical level.
Crucially, this breakout was accompanied by a dramatic spike in trading volume, which was multiple times its daily average. This is the market’s way of shouting that this move is real. It signals that the “smart money”—institutional funds and large investors—has entered the fray, validating the start of a new potential uptrend.
So, What's Next? Calculating the Price Target
One of the most attractive features of the Inverted Head and Shoulders pattern is that it provides a measurable, objective price target. This helps traders and investors gauge the potential upside of the move.
The Calculation Method:
Measure the Pattern’s Depth: Calculate the vertical distance from the lowest point of the Head to the neckline.
Example: Neckline (≈₹450) – Head’s Low (≈₹380) = ₹70.
Project the Target: Add this depth to the breakout point (the neckline price).
Example: Breakout Point (≈₹450) + Pattern Depth (₹70) = ₹520.
Based on the classic technical rules of this pattern, the breakout in IIFL Finance projects a minimum price objective of around ₹520.
It’s important to view this as a minimum target. In strong bull markets, breakouts from such significant bases can often exceed their initial targets as momentum builds and more investors join the rally.
Key Levels and Strategic Considerations Moving Forward
A successful breakout doesn’t mean the stock will move up in a straight line. Smart investors should be aware of key levels that will define the path forward.
1. Critical Support: The Old Resistance is the New Floor (≈₹450)
The neckline at ₹450, which was once a formidable ceiling, has now flipped to become a critical support level. In the world of technical analysis, this is a very common and powerful phenomenon. It is possible, and even healthy, for the stock to pull back and “retest” this breakout level. A successful retest, where the price dips to ₹450 and then bounces strongly, is an extremely bullish sign and often provides a second opportunity for those who missed the initial breakout.
2. Intermediate Resistance Levels:
On the way to the ₹520 target, there might be minor hurdles. Look for previous swing highs or psychological round numbers that could cause temporary pauses:
Psychological Level at ₹500: This round number will likely act as a point of minor resistance where some profit-taking may occur.
Previous Highs: Identify any other significant peaks from the past year that could slow down the ascent.
3. Strengthening the Bullish Case: Confluence of Indicators
A good analyst never relies on a single signal. The breakout in IIFL Finance is further strengthened by other positive technical indicators:
Moving Averages: The stock is now trading firmly above its 50-day and 200-day moving averages. A potential “Golden Cross” (where the 50-DMA crosses above the 200-DMA) could be on the horizon, which is another long-term bullish signal for investors.
Relative Strength Index (RSI): The RSI, a momentum oscillator, is showing strong upward momentum. Importantly, it is not yet in the extreme “overbought” territory (above 70-80), suggesting that the stock has more room to run before it becomes exhausted.
Risk Management: Protecting Your Capital
No matter how perfect a pattern looks, trading always involves risk. A disciplined approach to risk management is non-negotiable.
When is the pattern invalidated?
The bullish thesis would be called into question if the price were to fall back and close decisively below the neckline. A more conservative invalidation point would be a close below the low of the Right Shoulder (around ₹405). A break below this level would indicate that the breakout has failed and sellers have regained control.
Stop-Loss Strategy:
Aggressive Traders: Might place a stop-loss just below the neckline (e.g., at ₹440).
Conservative Investors: Might place a stop-loss below the low of the Right Shoulder, giving the trade more room to breathe and withstand a potential retest.
The Bigger Picture: Fundamental Context
While this analysis is primarily technical, it’s worth noting that major technical breakouts are often underpinned by improving fundamental conditions. Investors should research if there are any recent positive developments for IIFL Finance, such as strong quarterly earnings, positive management commentary, favorable regulatory changes, or a positive outlook for the non-banking financial company (NBFC) sector as a whole. A combination of strong technicals and solid fundamentals creates the most powerful investment thesis.
Conclusion: A New Chapter for IIFL Finance?
The technical evidence is clear: IIFL Finance has executed a high-conviction breakout from a major bullish reversal pattern. The Inverted Head and Shoulders formation, confirmed by a massive surge in volume, signals a profound shift in market sentiment from bearish to bullish.
The journey from a prolonged downtrend to a new uptrend has officially begun. The calculated price target of around ₹520 offers a clear roadmap for the potential upside. The former resistance at ₹450 now stands as the key support level to defend.
For traders and investors, this development presents a compelling opportunity. However, as with any market analysis, discipline is key. Watching the key support levels, managing risk diligently, and staying aware of the broader market context will be crucial to navigating the promising path that lies ahead for IIFL Finance. The battle has been won, and the bulls are now in command.
Disclaimer: This article is for informational and educational purposes only and should not be construed as investment or financial advice. The stock market is subject to market risks. All analysis is based on technical patterns and historical data, which does not guarantee future performance. Please conduct your own thorough research and consult with a certified financial advisor before making any investment decisions.