


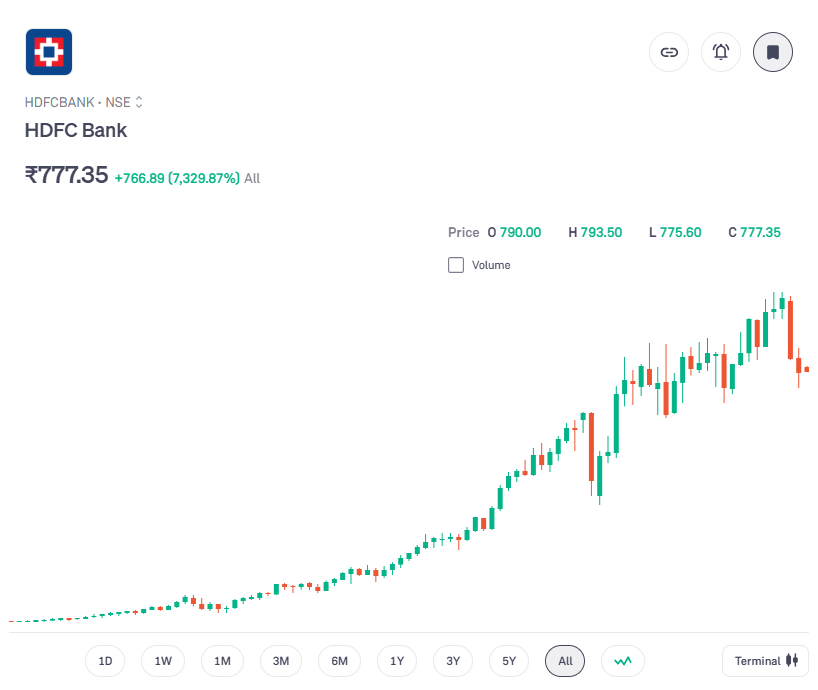
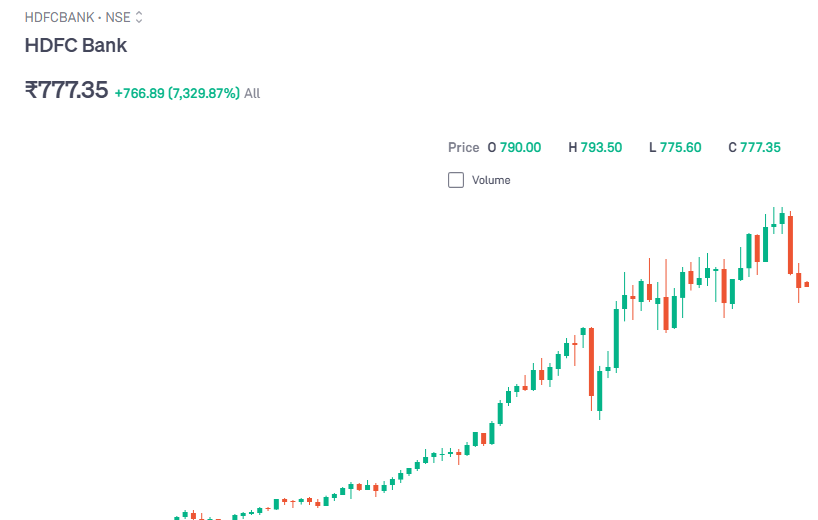
HDFC Bank Rounding Bottom Pattern Breakout
HDFC Bank Rounding Bottom Pattern Breakout: A Technical Analysis Deep Dive Investors and traders often seek reliable chart patterns that signal significant price movements in stocks. One such powerful technical formation is the Rounding Bottom Pattern—a smooth, U-shaped pattern that signals a market reversal from bearish to bullish. Recently, HDFC Bank , one of India’s leading private […]