Chart Pattern Double Top Chart Pattern Free Download PDF 2025 About The Double Top Chart Pattern Technical analysis uses several patterns in which traders can identify potential price direction shifts... BY pankajnifty March 15, 2024
Chart Pattern Double bottom chart pattern Double Bottom Pattern Meaning, Definition and Creation Watching stocks that decline strongly prompts you to sell before they rebound, turning... BY pankajnifty March 15, 2024
Strategy Stock Market Loss Recovery Strategy Introduction: Acknowledging the Stumble and Offering a Helping Hand All stock market investment discussions involve an aversion to discussing financial... BY pankajnifty March 15, 2024
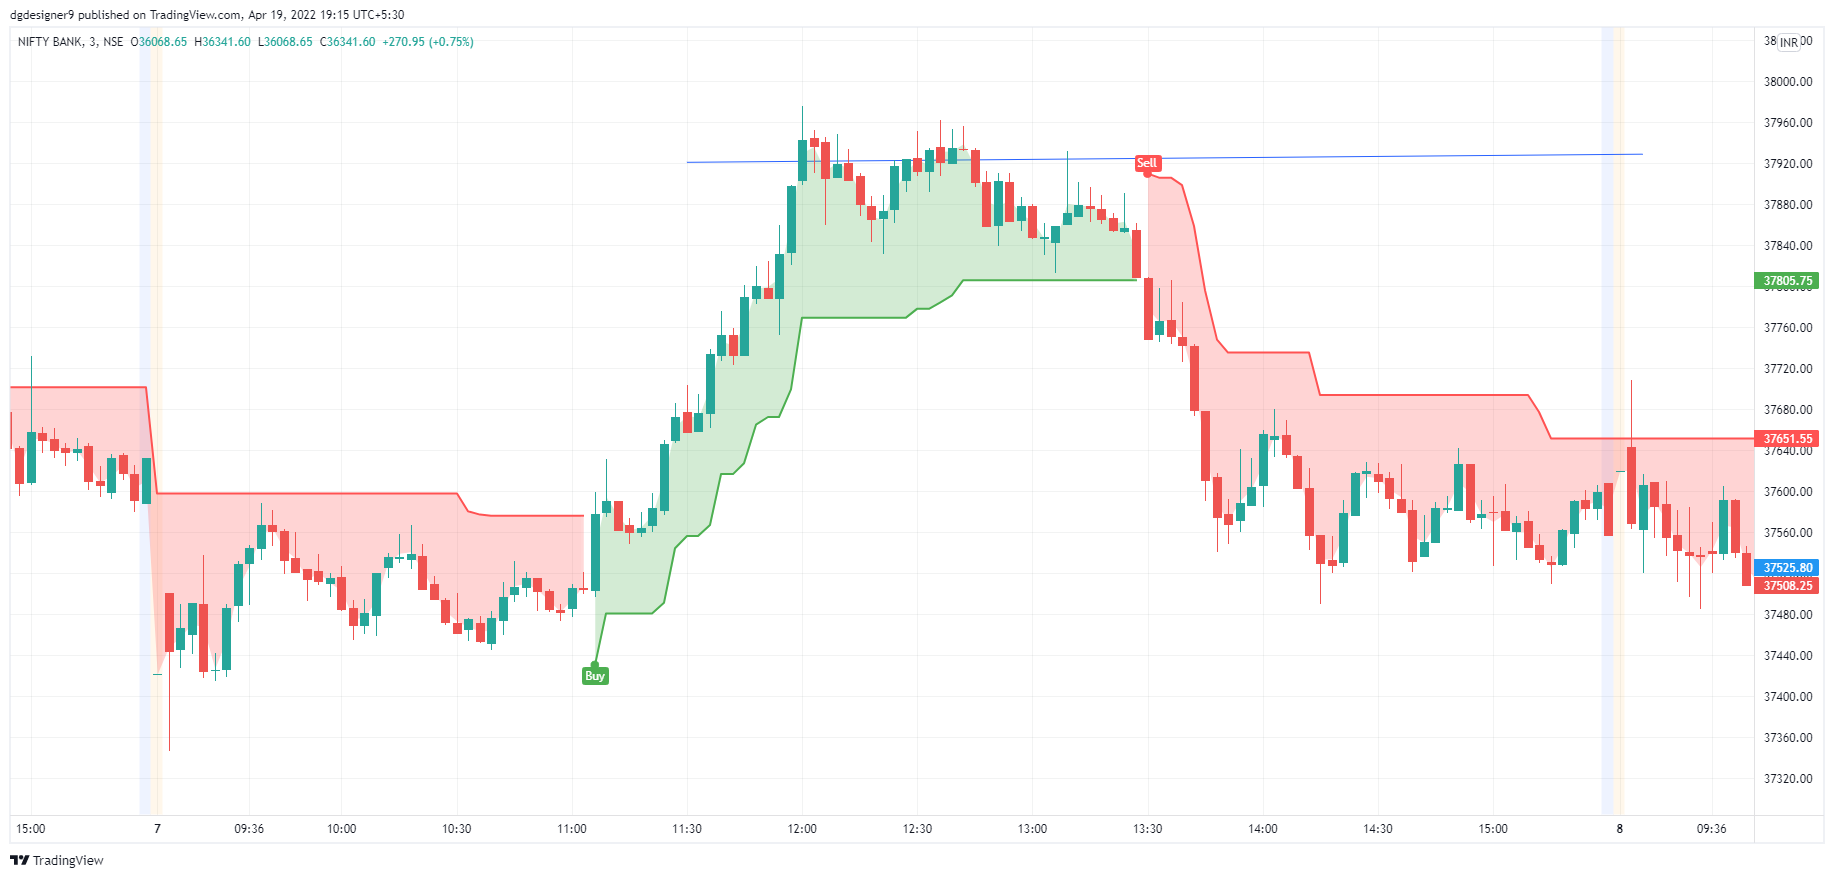
Strategy Super Trend Indicator Best Settings For Intraday Super Trend Indicator Super Trend is a trend following indicator similar to Moving Average. It is plotted on the price... BY pankajnifty March 15, 2024
Technical Analysis Technical Analysis Of Stocks Course Online What is Technical Analysis? Technical analysis is a tool or method used to predict the potential future price movement of... BY pankajnifty March 15, 2024
Chart Pattern Triangle Chart Patterns In Hindi त्रिकोण चार्ट पैटर्न्स: विशेषज्ञता से बताएँ (Triangle Chart Patterns In Hindi) त्रिकोण एक चार्ट पैटर्न है जो तकनीकी विश्लेषण में... BY pankajnifty March 15, 2024
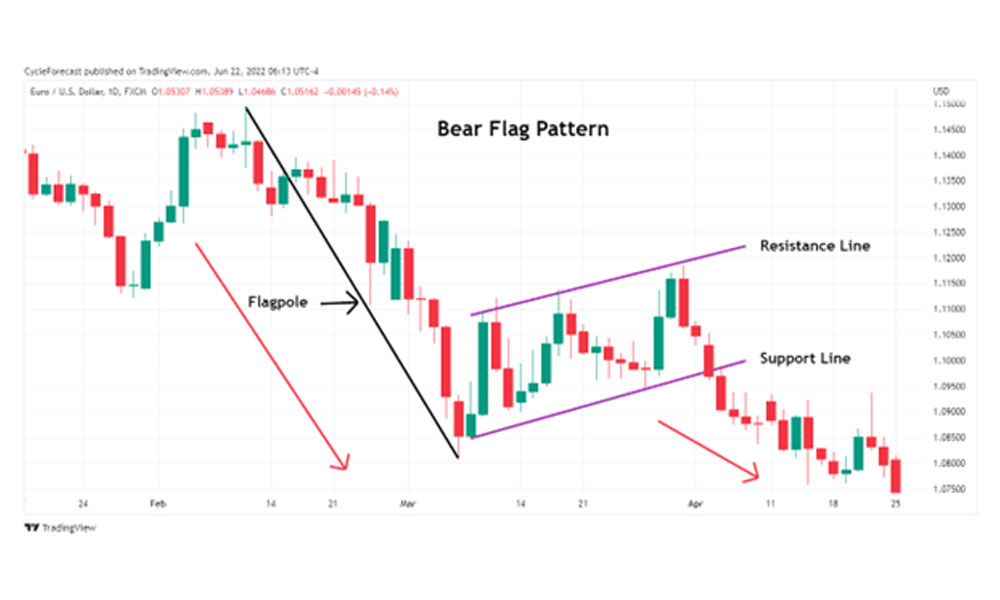
Chart Pattern Bearish Flag Pattern What is a Bearish Flag Pattern? A bull flag contains two bearish patterns, beginning with a flag followed by a... BY pankajnifty March 15, 2024
Technical Analysis How to Identify Trend in Day Trading Introduction Trading with the stock market is buying and selling with the flow.Why would you want to look for short... BY pankajnifty March 15, 2024
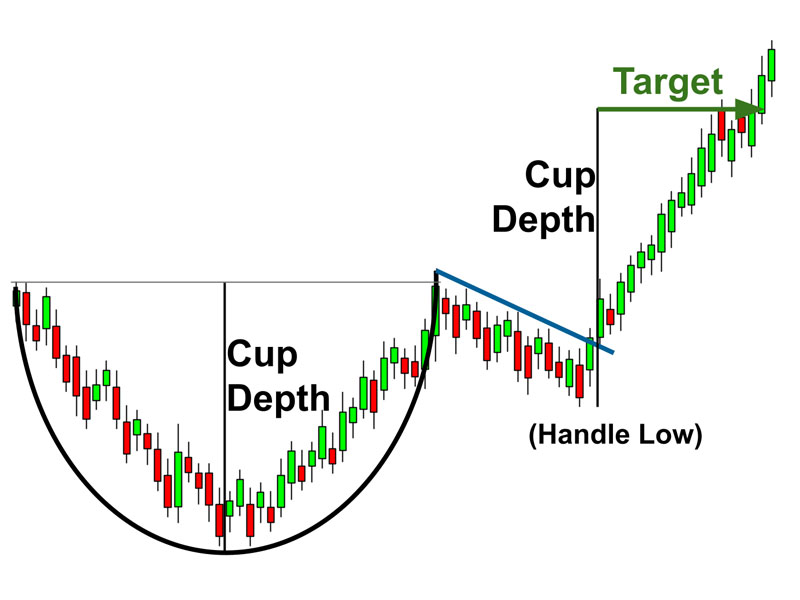
Chart Pattern Cup And Handle Chart Pattern What Is a Cup and Handle Pattern? A cup and handle price pattern on a security’s price chart is a... BY pankajnifty March 15, 2024
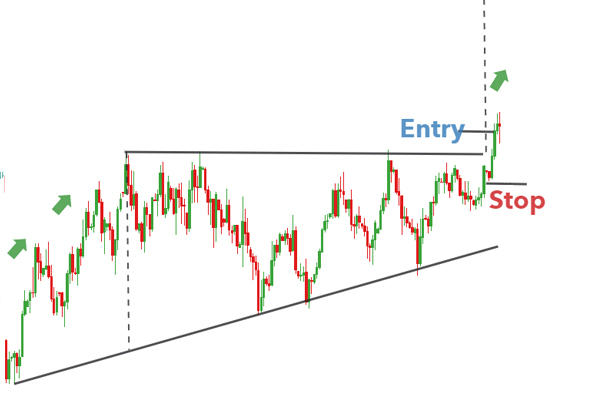
Chart Pattern Triangle Trading Strategy Introduction Triangles can be best described as a horizontal trading pattern. At the beginning of its construction, the triangle is... BY pankajnifty March 15, 2024